 HOUSEHOLD FINANCE AND CONSUMPTION NETWORK
- 19 pages
- Restricted
- October 2008
1. When a particular part of the population is especially important for a survey, oversampling that group can help the survey to provide better estimates. However, oversampling is not always easy or inexpensive. The ideal situation is one where information exists for the population that can help to discriminate the interesting sub-group and that information is available for sampling. Sometimes the information is weak for the intended purpose and sometimes there are restrictions on the use of information that make sampling difficult or impossible.1
2. This note tries to make explicit why, in the case of wealth surveys, oversampling of the relatively wealthy could be desirable and how some countries, with different procedures, have tried to achieve such oversampling. It draws on information available in papers by A. Kennickell, O. Bover and others (see the reference list). Technical questions of bias correction through unit non-response correction and variance reduction are not addressed directly here.
3. The first section of this note describes the distribution of wealth and differential response rates, and how oversampling can increase the efficiency of the survey and decrease non-response bias. The second section outlines possible features of oversampling as used in existing and prospective wealth surveys. The annex details some country procedures for oversampling, in the US, Spain, France and Cyprus
• In countries where issues related to wealth and specific financial instruments are priorities of the survey, the possibility of oversampling should be carefully studied, taking into account institutional circumstances and related costs.
• Given that in some countries, good oversampling strategies may require cooperation with other institutions and, hence, solving complex questions of governance and confidentiality, related initiatives should start as early as possible.
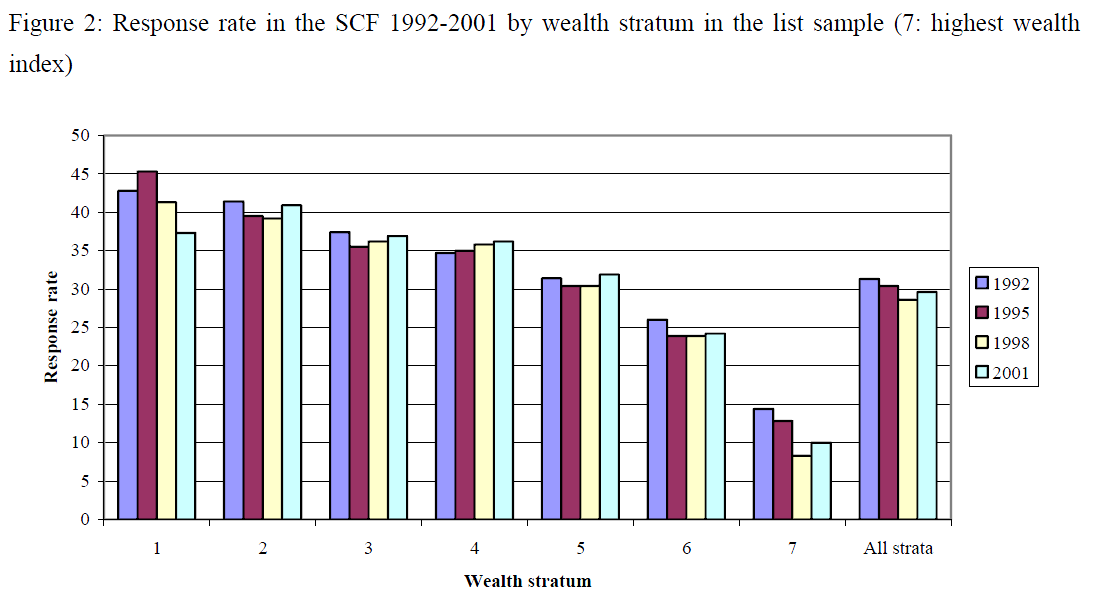
• The methodology and practices applied to oversample the wealthy may be further developed and improved in successive waves of the survey.1 Wealth is unequally distributed and the wealthy participate differently in surveys
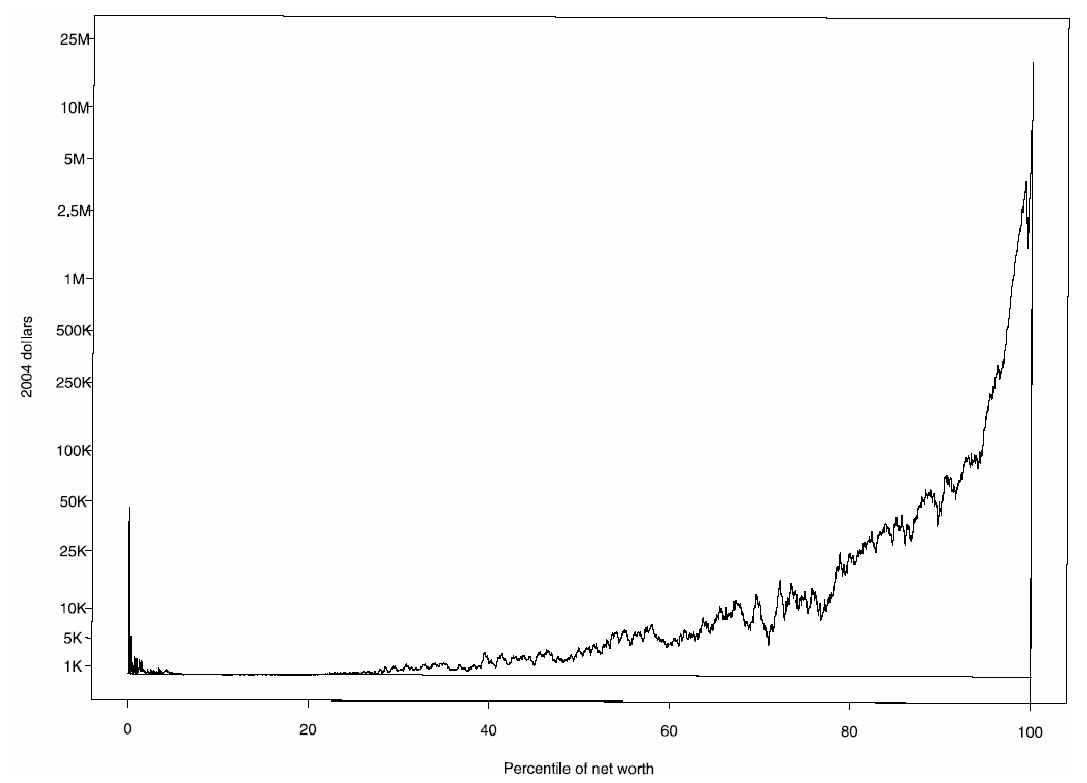
4. Wealth surveys are usually seen to face two conflicting constraints that affect the sample design. For the study of the broad financial behaviour of households, the sample should represent the population as a whole, and households should be selected such that the proportion of various “types” approximately mirrors the overall population. For the study of wealth, the sample should represent wealth as a whole, and each “euro” of wealth, which is highly skewed in its distribution, should contribute more or less in the same proportion; obviously, such a sample would require either oversampling of the wealthy or an enormous proportional sample. Practical considerations drive the need to consider a compromise to accommodate the two needs. The remainder of this section considers the trade-offs in greater detail.
1.1 Wealth is unequally distributed
5. Wealth inequality is thoroughly documented, and is usually much larger than income or consumption expenditure inequalities (Davies and Shorrocks [2000]). As an example, the two curves in Figure 1 show the Lorenz curves of real and financial assets of Italian households. The Lorenz curve, which shows the cumulative distribution of assets against the cumulative distribution of households ordered by wealth, can be used to assess the concentration of wealth. For example, based on the curve, the wealthiest 20% of the households in Italy hold approximately 75% of the financial wealth.
6. The problem of dealing with the skewness of wealth is compounded by the fact that the variety of assets possessed also tends to increase with the level of wealth. Some financial products are held by only a relatively small fraction of the population. In other words, other variables of interest may be even more unequally distributed over the population than aggregate net wealth: government securities for example are held by 8% of the population in Italy according to SHIW. This implies that analysis of the behaviour of bond holders out of a total sample of 8,000 households will have to be done only on 640 households in the absence of oversampling.
7. Using data from a purely random selection of units, for example, would at best yield a statistically very inefficient estimate of the distribution of wealth. As Kennickell (2005) points out, where there are groups in the population that either posses a rare trait of interest or that exhibit relatively high variability of the variable of interest, there may be gains from sampling disproportionately larger fraction of observations from those groups. In the SCF, of 400 observations with direct holding of bonds, only 10% were from the area probability sample (the type of proportional sample used as one component of that survey).
8. To give an example taken from the Spanish survey on wealth (EFF), it is estimated from tax records, as shown in Bover (2004), that 0.4% of the population of households holds 40% of taxable wealth. In a random survey of 5000 households we would expect only 20 such households (this is the maximum given that the response rate for rich households is lower, see below). In contrast, the EFF sample contains 500 of them. In the SCF the effect is similar: without oversampling there would only be 41 households in the top 1% of the wealth distribution; with the oversampling there are 715.
1.2 Response rates are lower for wealthy households
9. A second issue is that response rates are most of the time not uniform across the sample, but tend to have a clear non-random component. Although non-response is a complex phenomenon, it is clear in at least three countries (ES, IT and the US) that wealthier households tend to be less likely to respond, either through outright refusal, more non-contact or even interviewer decisions (different conversion techniques, etc.). Figures 2 and 3 document the decrease in response rate as the wealth increases, in the SCF and in the EFF. Kennickell points out that this decrease could be the combination of several factors, both on the respondent and on the interviewer side, and has to be borne in mind in any case, whether oversampling is implemented or not.
10. Although no oversampling takes place in SHIW, a specific study in 1998 (d’Alessio and Faiella [2002]) with clients of a commercial bank showed that non-response in the experiment was correlated with wealth; the net financial wealth of respondents is only 58% of the wealth of non-respondents, resulting in an important bias. (As mentioned in D’Aurizio et al. [2007], there is another problem, which cannot be addressed with oversampling: the under-reporting of assets).
11. The differential non-response rate, if it is not compensated by post-survey adjustments, will cause measurement bias. However, if the sample is selected so that some factors correlated with aspects of wealth can be observed for all sample elements (register based or collected through the survey), this information may be used to guide post-survey adjustments to compensate for non-response and possibly to reduce sampling error.
…
Sampling in the Spanish EFF survey
54. This section is based on Bover (2004).
55. The oversampling in the EFF was achieved thanks to the collaboration of the INE (Spain’s statistical institute) and the Tax Authorities (TA), through a complex co-ordination mechanism that enabled the TA’s strict confidentiality requirements to be observed at all times. Specifically, the TA devised a wealth strata-based random sample drawing on the Padrón Continuo (a continuously updated municipal population census) provided by INE, following the guidelines of the sample design prepared by INE. This provides the EFF with a unique population frame for its sample, thereby ensuring the representativeness of the information obtained while attaining accurate information on the behaviour of the richest household segment. Finally, a complex procedure for replacing non-respondent households was incorporated into the sample design, thus ensuring the maintenance of the sample’s desirable characteristics.


