The following report was released November 14, 2013 by the Financial Stability Board, an international organization that includes representatives from the G-20 nations, European Central Bank, European Commission, World Bank, International Monetary Fund, Organisation for Economic Co-operation and Development, as well as the Bank for International Settlements.
Global Shadow Banking Monitoring Report 2013
- 48 pages
- November 14, 2013
The shadow banking system can broadly be described as credit intermediation involving entities and activities outside the regular banking system. Intermediating credit through non-bank channels can have important advantages and contributes to the financing of the real economy, but such channels can also become a source of systemic risk, especially when they are structured to perform bank-like functions (e.g. maturity transformation and leverage) and when their interconnectedness with the regular banking system is strong. Therefore, appropriate monitoring of shadow banking helps to mitigate the build-up of such systemic risks.
The FSB set out its approach for monitoring the global shadow banking system in its report to the G20 in October 2011. This report presents the results of the third annual monitoring exercise following this approach, using end-2012 data. The report includes data from 25 jurisdictions and the euro area as a whole, bringing the coverage of the monitoring exercise to about 80% of global GDP and 90% of global financial system assets.
As in previous exercises, the primary focus of the monitoring is a ‘macro-mapping’ based on national Flow of Funds and Sector Balance Sheet data (hereafter Flow of Funds), that looks at all non-bank financial intermediation to provide a conservative estimate which ensures that data gathering and surveillance cover the areas where shadow banking-related risks to the financial system might potentially arise. Sections 2 to 4 and Section 6 of the report present the result of the macro-mapping, including size and growth trends of the shadow banking system, cross-jurisdiction analysis, trends in sub-sectors and interconnectedness with the banking system.
…
The main findings from the 2013 exercise are as follows:
• According to the ‘macro-mapping’ measure, based on ‘Other Financial Intermediaries’ (OFIs), non-bank financial intermediation grew by $5 trillion in 2012 to reach $71 trillion. This provides a conservative proxy of the global shadow banking system, which can be further narrowed down.
• By absolute size, advanced economies remain the ones with the largest non-bank financial systems. Globally OFI assets represent on average about 24% of total financial assets, about half of banking system assets and 117% of GDP. These patterns have been relatively stable since the crisis.
• OFI assets grew by +8.1% in 2012, helped by a general increase in valuation of global financial markets, while bank assets were relatively stable as valuation effects were counterbalanced by shrinking balance sheets. The global growth trend of OFI assets masks considerable differences across jurisdictions, with growth rates ranging from -11% in Spain to +42% in China.
• Emerging market jurisdictions showed the most rapid increases in non-bank financial system assets. Four emerging market jurisdictions had 2012 growth rates for non-bank financial intermediation above 20%. However, this rapid growth is from a relatively small base. While the non-bank financial system may contribute to financial deepening in these jurisdictions, careful monitoring is still required to detect any increases in risk factors (e.g. maturity transformation or leverage) that could arise from the rapid expansion of credit provided by the non-bank sector.
• Among the OFI sub-sectors that showed the most rapid growth in 2012 are real estate investment trusts (REITs) and funds (+30%), other investment funds (+16%) and hedge funds (+11%). Of note that the growth rate for hedge funds should be interpreted with caution as the FSB macro-mapping exercise significantly underestimates the size of the hedge fund sector. The results of the recent IOSCO hedge fund survey provide a more accurate picture of the size of the hedge fund sector (see below and Section 4) but do not provide an estimate of its growth.
• Using more granular data reported by 20 jurisdictions, an attempt was made to narrow down the conservative estimate of non-bank financial intermediation (see Section 5). This led to a reduction of some $20 trillion in size, therefore bringing the total OFI assets for the 20 jurisdictions that reported granular data from $55 trillion to $35 trillion. Using the narrowed down estimate, the growth rate of shadow banking in 2012 was +2.9%, instead of +6.4% using the conservative estimate based on OFI assets for the limited sample of jurisdictions that submitted data for narrowing down. The FSB will continue to refine the methodologies in narrowing down the estimate as well as encourage its member jurisdictions to collect the relevant data.
• There was no sizeable change in the level of interconnectedness between the banking and the non-bank financial system in 2012. However, the relevance of the findings in this area (see Section 6) is hampered by the absence of reporting of this data by a number of large jurisdictions.
…
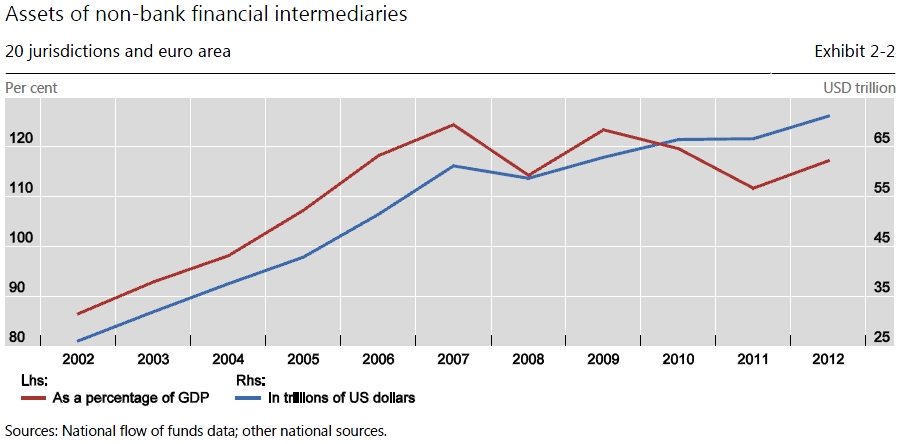
The size of non-bank financial intermediation was equivalent to 117% of GDP in aggregate at the end of 2012 for 20 jurisdictions and the euro area, which is still well below the peak level of 125% in 2007. Compared to the end of 2011, non-bank financial intermediation as a share of GDP increased by 6 percentage points in 2012 (Exhibit 2-2).
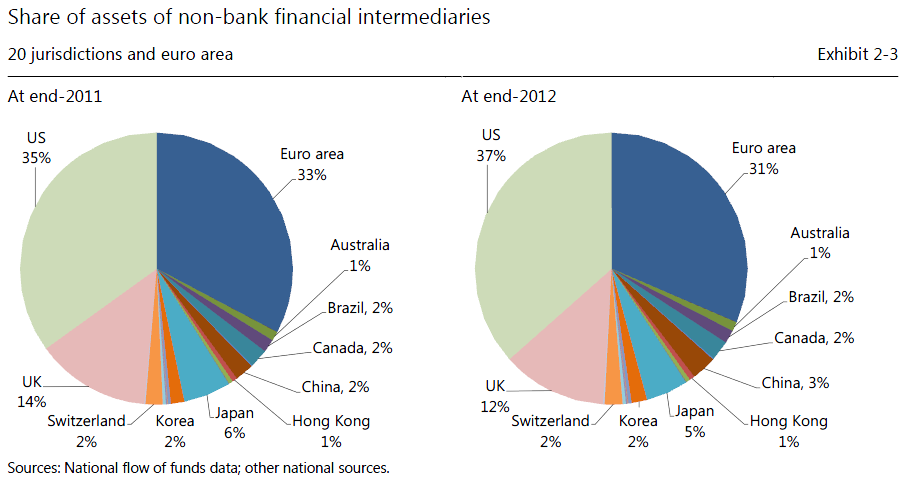
The US had the largest system of non-bank financial intermediation at the end of 2012 with assets of $26 trillion, followed by the euro area ($22 trillion), the UK ($9 trillion) and Japan ($4 trillion). Compared to 2011, the US share of total non-bank financial intermediation for 20 jurisdictions and the euro area increased from 35% to 37%, whereas the UK’s share decreased from 14% to 12% (Exhibit 2-3).


