FEDERAL RESERVE SYSTEM: Opportunities Exist to Strengthen Policies and Processes for Managing Emergency Assistance
- 266 pages
- July 2011
On numerous occasions in 2008 and 2009, the Federal Reserve Board invoked emergency authority under the Federal Reserve Act of 1913 to authorize new broad-based programs and financial assistance to individual institutions to stabilize financial markets. Loans outstanding for the emergency programs peaked at more than $1 trillion in late 2008. The Federal Reserve Board directed the Federal Reserve Bank of New York (FRBNY) to implement most of these emergency actions. In a few cases, the Federal Reserve Board authorized a Reserve Bank to lend to a limited liability corporation (LLC) to finance the purchase of assets from a single institution. In 2009 and 2010, FRBNY also executed large-scale purchases of agency mortgage-backed securities to support the housing market. The table below provides an overview of all emergency actions covered by this report. The Reserve Banks’ and LLCs’ financial statements, which include the emergency programs’ accounts and activities, and their related financial reporting internal controls, are audited annually by an independent auditing firm. These independent financial statement audits, as well as other audits and reviews conducted by the Federal Reserve Board, its Inspector General, and the Reserve Banks’ internal audit function, did not report any significant accounting or financial reporting internal control issues concerning the emergency programs.
The Reserve Banks, primarily FRBNY, awarded 103 contracts worth $659.4 million from 2008 through 2010 to help carry out their emergency activities. A few contracts accounted for most of the spending on vendor services. For a significant portion of the fees, program recipients reimbursed the Reserve Banks or the fees were paid from program income. The Reserve Banks relied more extensively on vendors for programs that assisted a single institution than for broad-based programs. Most of the contracts, including 8 of the 10 highest-value contracts, were awarded noncompetitively, primarily due to exigent circumstances. These contract awards were consistent with FRBNY’s acquisition policies, but the policies could be improved by providing additional guidance on the use of competition exceptions, such as seeking as much competition as practicable and limiting the duration of noncompetitive contracts to the exigency period. To better ensure that Reserve Banks do not miss opportunities to obtain competition and receive the most favorable terms for services acquired, GAO recommends that they revise their acquisition policies to provide such guidance.
…
Large Global Institutions Were Among the Largest Users of Several Programs
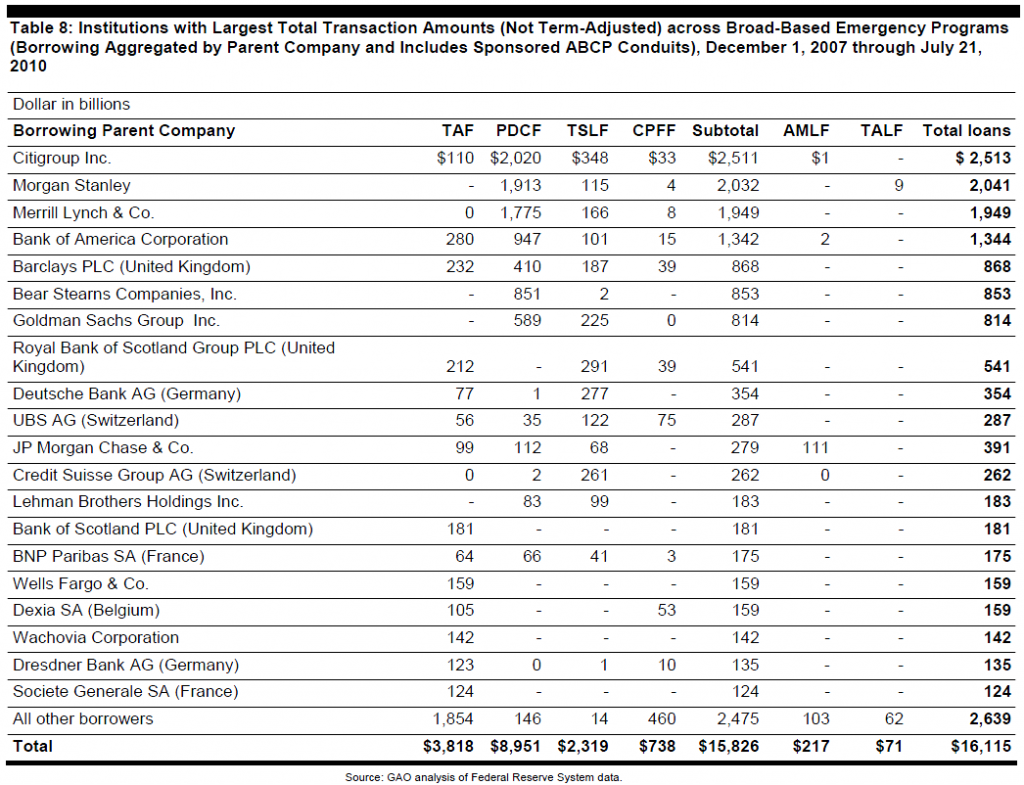
Several of the programs saw greater use by large global institutions that were significant participants in the funding markets targeted by the Federal Reserve Board. Tables 8 and 9 rank the largest borrowing institutions according to aggregate borrowing (irrespective of differences in term to maturity) and total borrowing after adjusting for differences in loan terms. For both tables, we show transaction amounts for AMLF and TALF, but do not factor these amounts into the rankings as entities participating in these programs served as intermediary borrowers whose purchases provided liquidity support to other market participants. We aggregated dollar transaction amounts for borrowing entities at the parent company level. For each parent company, total amounts borrowed include amounts borrowed by the parent company, its subsidiaries, branches or agencies, and in the case of CPFF, dollar amounts of ABCP issued by entities sponsored by the holding company or one of its subsidiaries. In cases where we identified an acquisition that took place during the operation of a program, we consolidated transaction amounts following the completion of the acquisition. Table 8 aggregates total dollar transaction amounts by adding the total dollar amount of all loans but does not adjust these amounts to reflect differences across programs in the term over which loans were outstanding. For example, an overnight PDCF loan of $10 billion that was renewed daily at the same level for 30 business days would result in an aggregate amount borrowed of $300 billion although the institution, in effect, borrowed only $10 billion over 30 days. In contrast, a TAF loan of $10 billion extended over a 1-month period would appear as $10 billion. As a result, the total transaction amounts shown in table 8 for PDCF are not directly comparable to the total transaction amounts shown for TAF and other programs that made loans for periods longer than overnight.
…


